
We have already seen that a convenient way to describe a line in three dimensions is to provide a vector that "points to'' every point on the line as a parameter $t$ varies, like $$\langle 1,2,3\rangle+t\langle 1,-2,2\rangle =\langle 1+t,2-2t,3+2t\rangle.$$ Except that this gives a particularly simple geometric object, there is nothing special about the individual functions of $t$ that make up the coordinates of this vector—any vector with a parameter, like $\langle f(t),g(t),h(t)\rangle$, will describe some curve in three dimensions as $t$ varies through all possible values.
Example 15.1.1 Describe the curves $\langle \cos t,\sin t,0\rangle$, $\langle \cos t,\sin t,t\rangle$, and $\langle \cos t,\sin t,2t\rangle$.
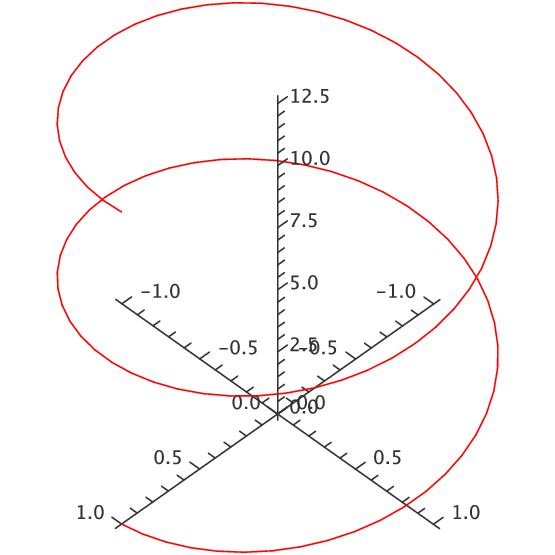
As $t$ varies, the first two coordinates in all three functions trace out the points on the unit circle, starting with $(1,0)$ when $t=0$ and proceeding counter-clockwise around the circle as $t$ increases. In the first case, the $z$ coordinate is always 0, so this describes precisely the unit circle in the $x$-$y$ plane. In the second case, the $x$ and $y$ coordinates still describe a circle, but now the $z$ coordinate varies, so that the height of the curve matches the value of $t$. When $t=\pi$, for example, the resulting vector is $\langle -1,0,\pi\rangle$. A bit of thought should convince you that the result is a helix. In the third vector, the $z$ coordinate varies twice as fast as the parameter $t$, so we get a stretched out helix. Both are shown in figure 15.1.1. On the left is the first helix, shown for $t$ between 0 and $4\pi$; on the right is the second helix, shown for $t$ between 0 and $2\pi$. Both start and end at the same point, but the first helix takes two full "turns'' to get there, because its $z$ coordinate grows more slowly. $\square$
|
|
A vector expression of the form $\langle f(t),g(t),h(t)\rangle$ is called a vector function; it is a function from the real numbers $\R$ to the set of all three-dimensional vectors. We can alternately think of it as three separate functions, $x=f(t)$, $y=g(t)$, and $z=h(t)$, that describe points in space. In this case we usually refer to the set of equations as parametric equations for the curve, just as for a line. While the parameter $t$ in a vector function might represent any one of a number of physical quantities, or be simply a "pure number'', it is often convenient and useful to think of $t$ as representing time. The vector function then tells you where in space a particular object is at any time.
Vector functions can be difficult to understand, that is, difficult to picture. When available, computer software can be very helpful. When working by hand, one useful approach is to consider the "projections'' of the curve onto the three standard coordinate planes. We have already done this in part: in example 15.1.1 we noted that all three curves project to a circle in the $x$-$y$ plane, since $\langle \cos t,\sin t\rangle$ is a two dimensional vector function for the unit circle.
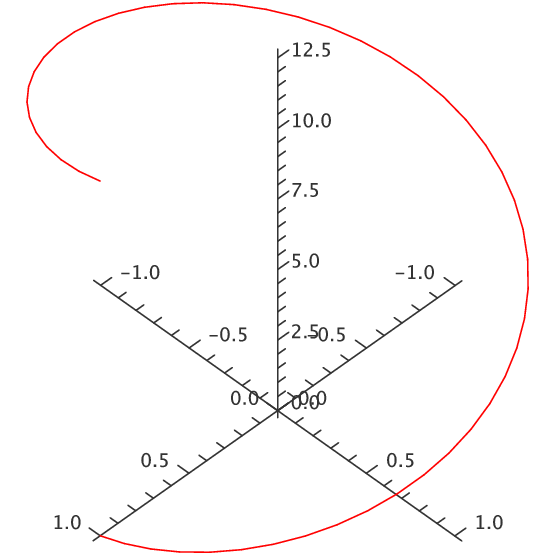
Example 15.1.2 Graph the projections of $\langle \cos t,\sin t,2t\rangle$ onto the $x$-$z$ plane and the $y$-$z$ plane. The two dimensional vector function for the projection onto the $x$-$z$ plane is $\langle \cos t, 2t\rangle$, or in parametric form, $x=\cos t$, $z=2t$. By eliminating $t$ we get the equation $x=\cos(z/2)$, the familiar curve shown on the left in figure 15.1.2. For the projection onto the $y$-$z$ plane, we start with the vector function $\langle \sin t, 2t\rangle$, which is the same as $y=\sin t$, $z=2t$. Eliminating $t$ gives $y=\sin(z/2)$, as shown on the right in figure 15.1.2. $\square$
Exercises 15.1
You can use Sage to graph spacecurves to check your work:
Ex 15.1.1 Describe the curve ${\bf r}=\langle \sin t,\cos t,\cos 8t\rangle$.
Ex 15.1.2 Describe the curve ${\bf r}=\langle t\cos t,t\sin t,t\rangle$.
Ex 15.1.3 Describe the curve ${\bf r}=\langle t,t^2,\cos t\rangle$.
Ex 15.1.4 Describe the curve ${\bf r}=\langle \cos(20t)\sqrt{1-t^2},\sin(20t)\sqrt{1-t^2},t\rangle$
Ex 15.1.5 Find a vector function for the curve of intersection of $x^2+y^2=9$ and $y+z=2$. (answer)
Ex 15.1.6 A bug is crawling outward along the spoke of a wheel that lies along a radius of the wheel. The bug is crawling at 1 unit per second and the wheel is rotating at 1 radian per second. Suppose the wheel lies in the $y$-$z$ plane with center at the origin, and at time $t=0$ the spoke lies along the positive $y$ axis and the bug is at the origin. Find a vector function ${\bf r}(t)$ for the position of the bug at time $t$. (answer)
Ex 15.1.7 What is the difference between the parametric curves $f(t)=\langle t, t, t^2 \rangle$, $g(t)=\langle t^2, t^2, t^4 \rangle$, and $h(t)=\langle \sin(t), \sin(t), \sin^2(t) \rangle$as $t$ runs over all real numbers?
Ex 15.1.8 Plot each of the curves below in 2 dimensions, projected onto each of the three standard planes (the $x$-$y$, $x$-$z$, and $y$-$z$ planes).
a. $f(t)=\langle t, t^3, t^2 \rangle$, $t$ ranges over all real numbers
b. $f(t)=\langle t^2, t-1, t^2+5 \rangle$ for $0\leq t \leq 3$
Ex 15.1.9 Given points $A=(a_1, a_2, a_3)$ and $B=(b_1, b_2, b_3)$, give parametric equations for the line segment connecting $A$ and $B$. Be sure to give appropriate $t$ values.
Ex 15.1.10 With a parametric plot and a set of $t$ values, we can associate a `direction'. For example, the curve $\langle \cos t, \sin t \rangle$ is the unit circle traced counterclockwise. How can we amend a set of given parametric equations and $t$ values to get the same curve, only traced backwards?