
Environmental Studies
Envision a better world.
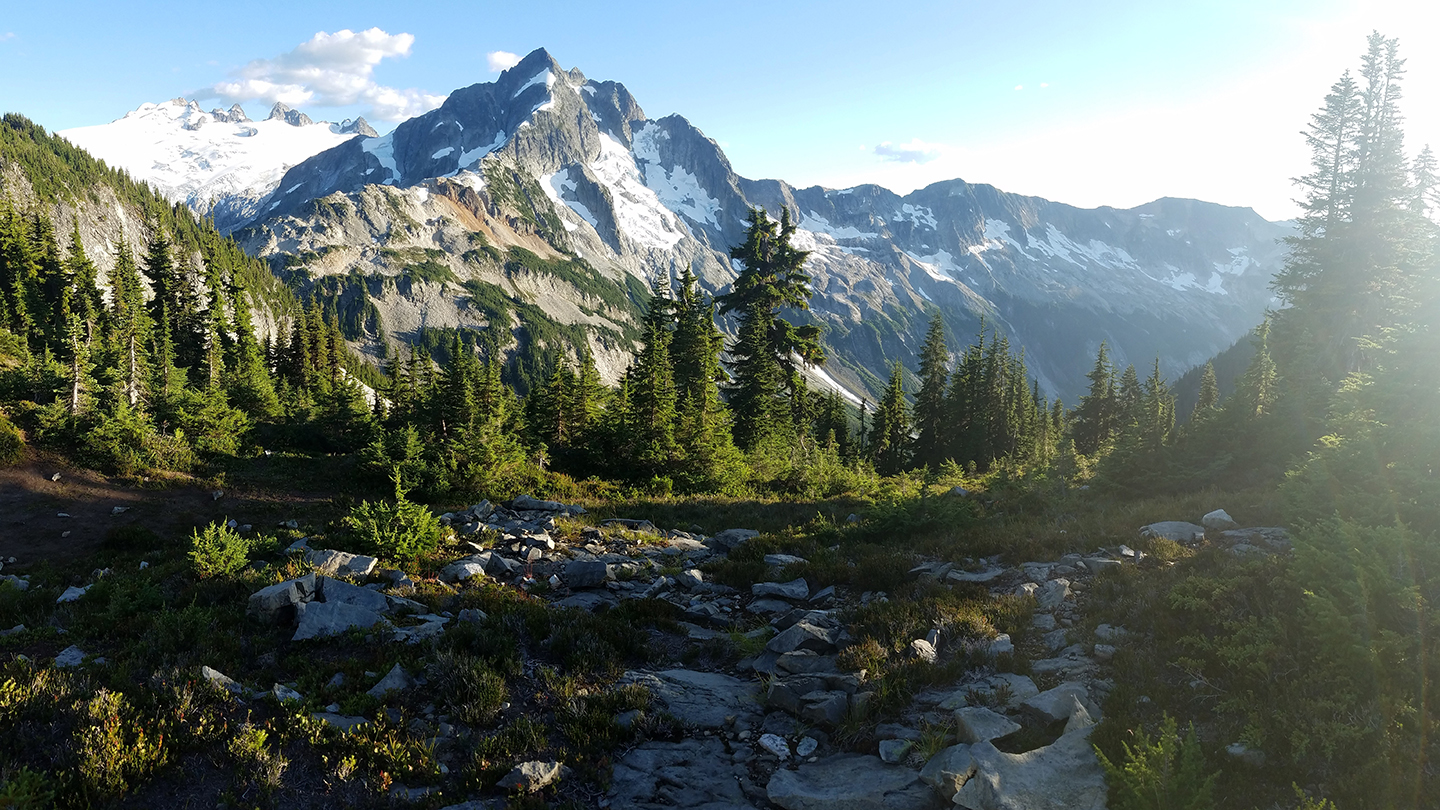
The natural world undeniably shapes and is shaped by humans. To understand and influence this interaction for the better, you need the intellectual and practical tools to study environmental issues from multiple points of view. The Environmental Studies majors at Whitman College brings science and the humanities together in a flexible, unique academic path that will give you the tools to make a difference as a global citizen.
3 Reasons to Study Environmental Studies at Whitman
Learn to Think Big and Deep
Complex environmental problems have no simple solutions. That’s why the Environmental Studies major at Whitman pairs core environmental courses with social sciences, physical sciences and humanities. You will learn to think deeply about our interactions with the environment from multiple perspectives for a dynamic education with wide-ranging applications.
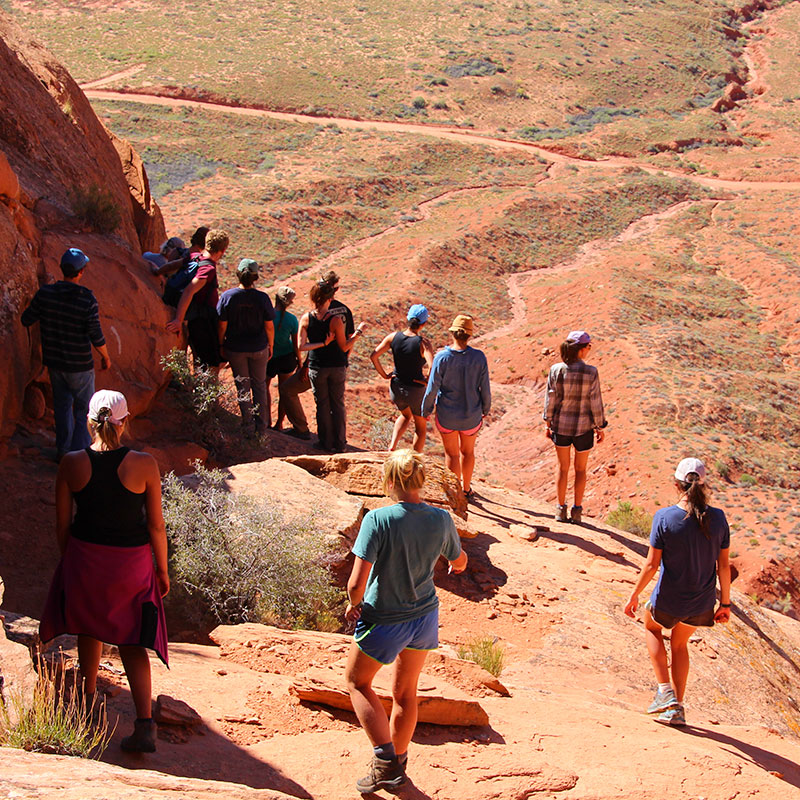
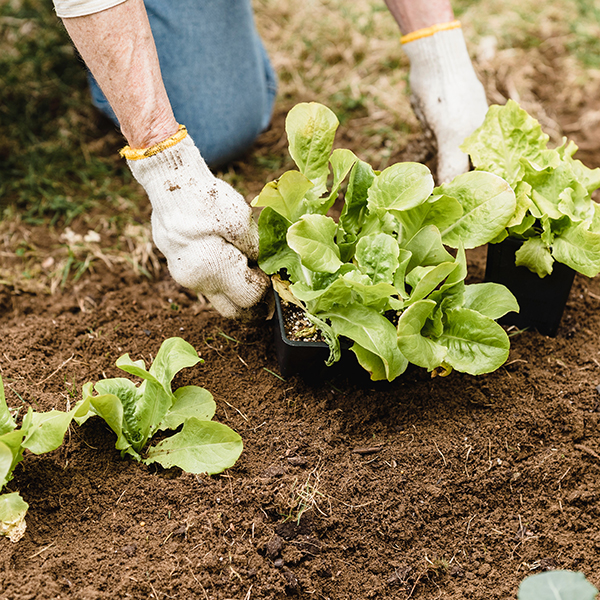
Get Outside the Classroom
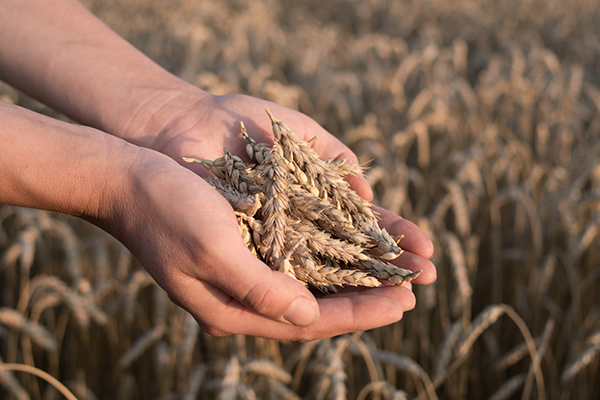
Your fieldwork in Environmental Studies will be hands-on. From weekly field seminars around campus to internships with local farms and water projects, you’ll learn by doing. And through study abroad opportunities, like geology camp in New Zealand or research in Costa Rica, you’ll network with global environmental experts.
Answer Your Own Questions
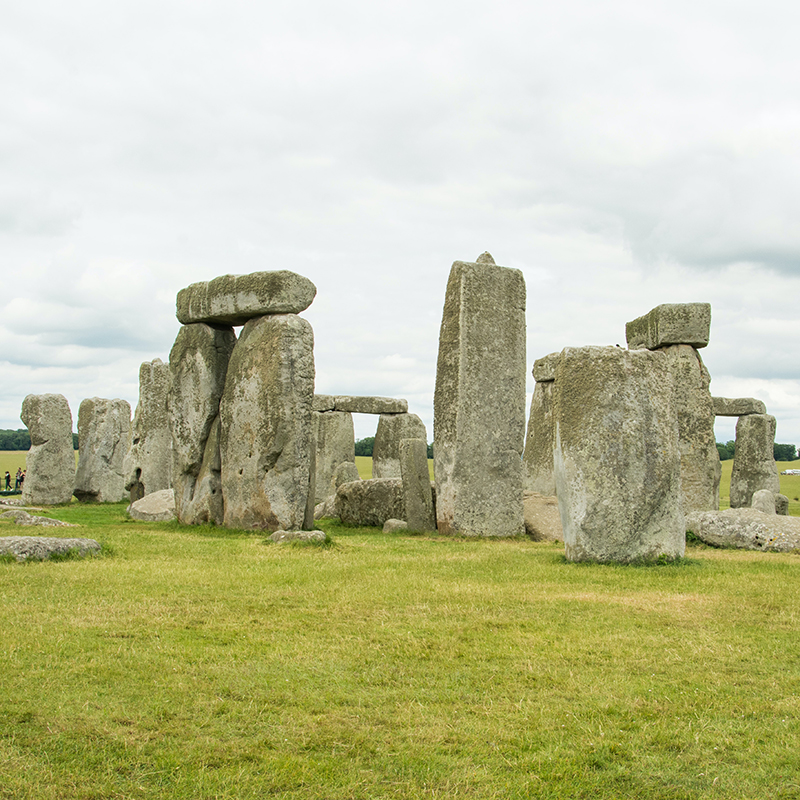
As an Environmental Studies major, you’ll build and share knowledge that stems from your own curiosity. You’ll work closely with a faculty advisor to shape an original research project that could take you anywhere from ancient Rome or the Mojave Desert (like recent majors) en route to your core interests.
Interested in Environmental Studies?
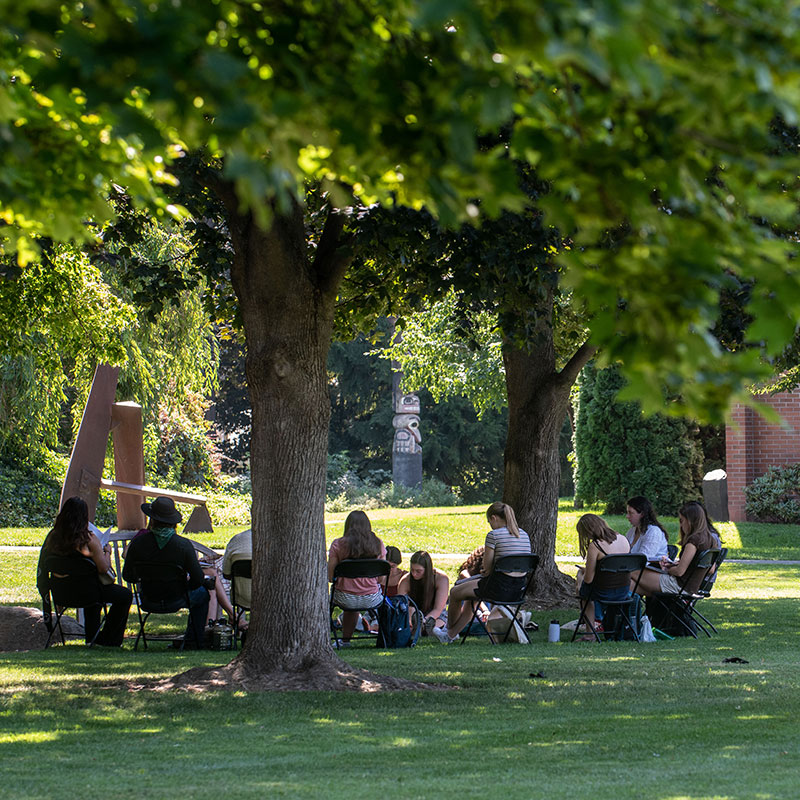
We’d love to send you information, including more on academic majors and student life at our beautiful campus in Walla Walla, Washington.
“I transferred to Whitman from another liberal arts college for several reasons but, first and foremost the Environmental Studies program, which so effectively integrates many fields of study and professors into a holistic learning environment. The professors I have learned from thus far have exceeded my expectations, as they have been so attentive to understanding me as a person and learner, and working to guide me based on interests. Another reason I chose to transfer was the strong and tight-knit community that Whitman possesses—on campus, in the classroom and in sports.”
Our Whitman Student Voices BlogFaculty

Courses in Environmental Studies
See just a few of the fascinating courses you might take.
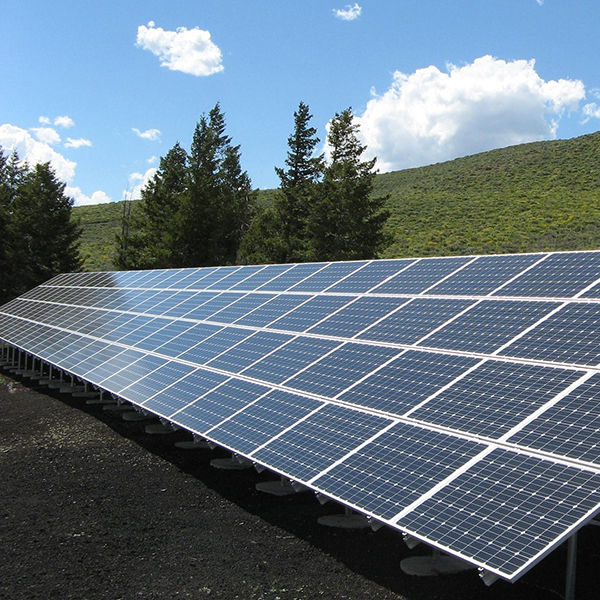
Introduction to Environmental Studies
With perspectives from the sciences, social sciences and humanities—as well as weekly field trips—this class introduces you to the many ways environmental issues touch on our lives. Join this class for excursions to energy-producing facilities, farms, paper mills, different ecosystems, the Johnston Wilderness Campus and more.
Methods of Environmental Analysis
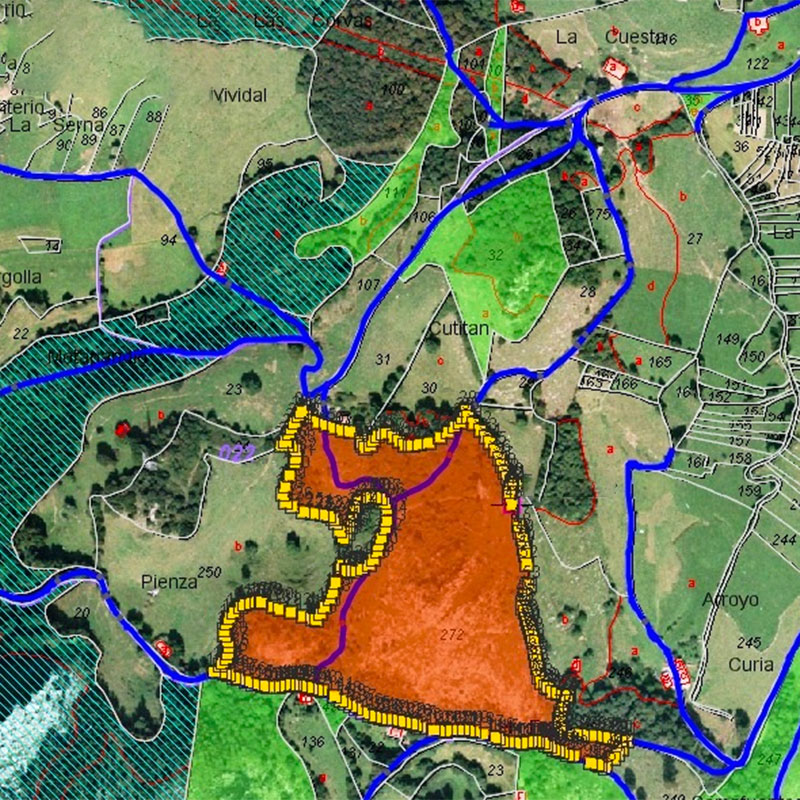
Get hands-on experience with the analytic methods and tools environmental scientists use. In this course, you’ll build a basic understanding of statistics and learn to interpret environmental data. You’ll learn how scientists conduct environmental surveys. And you’ll get hands-on practice with key technology, like Geographic Information Systems software.

Environmental Sociology
How is the environment shaped by society, and how is society shaped by the environment? Who controls access to resources? And who is impacted by environmental hazards? Dive deep into the theories, debates and questions that occupy the minds of environmental sociologists.
People/Nature/Technology: North American Landscapes
How have people throughout North American history understood “nature” and their relationship to it? What modes of shaping the world around us are acceptable or problematic—and who decides? In this course, you’ll explore these and other historical questions from the perspectives of the indigenous nations, colonizing settlers, forced migrants and voluntary ones who’ve inhabited North America.
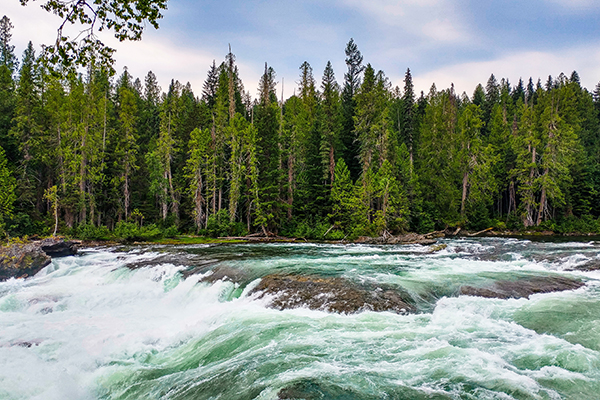
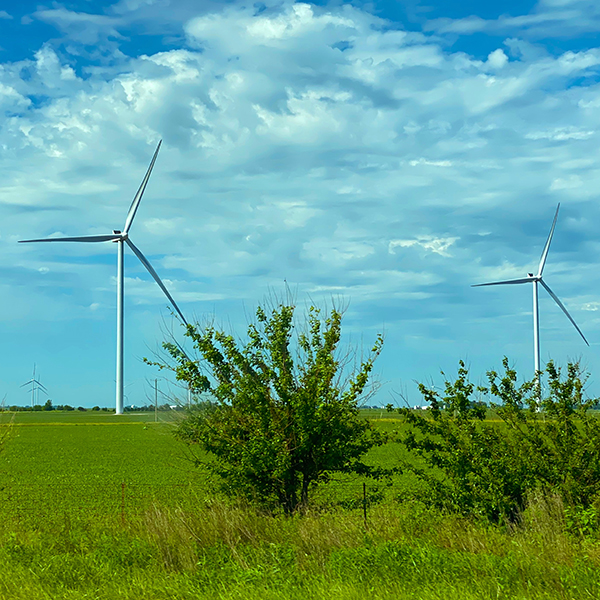
Water in the West
This course covers the North American West’s complicated history with water. You’ll discuss issues like water resource management, power generation, water law, water economics and climate change as you investigate strategies for a sustainable future.

Environmental Justice
Environmental problems are often experienced differently according to the race, gender, class and nationality of the people affected. Through case studies of environmental injustice, this course weaves together perspectives from the sciences, humanities and social sciences to understand links between pollution and human health, how inequality affects decision making, and the methods people use to challenge and change their circumstances.
Combined Majors


Learn More About the Field Course: Land, Water, Justice
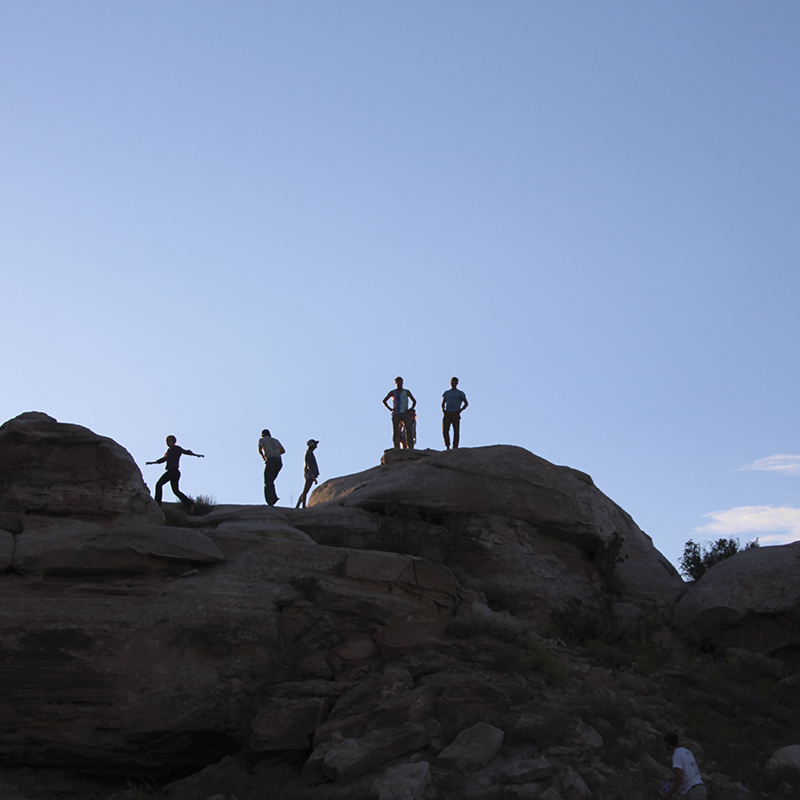
Amazing Experiences You Can Pursue
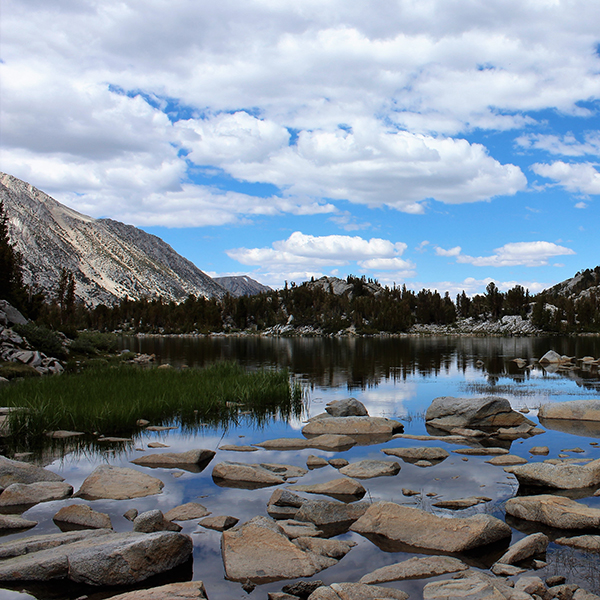
Roam for a semester of purposeful wandering. Whitman’s Semester in the West is your chance to meet professionals and community members on the forefront of regional environmental action and policy. By day, you’ll learn about the diverse lands of the West. By night you’ll camp out and bond with your classmates.
Pursue an internship with impact. Environmental Studies majors can find paid internships of all sorts. Whitman students have worked to improve recycling on campus, run “garden recesses” at local schools, managed fungal cultures in a mushroom lab, examined museum archives and worked with environmental experts on many other important projects.
Live green at Whitman. Campus organizations like the Organic Garden Club, Campus Climate Coalition, Glean Team and Outdoor Program are exciting ways to get involved and take environmental action. You can even live with other students in the Outhouse, an alternative housing option with special environmental programming.
Your Questions Answered
Yes! While Environmental Studies is a fun major that boasts regular field trips and outdoor opportunities, it is first and foremost an academic course of study that brings together multiple disciplines in the humanities and sciences for a broad look at complex environmental issues. Your coursework will draw on theory, analysis and critical thinking, all skills you need for graduate studies. And the senior thesis project will help you hone your research skills as you complete original scholarship in collaboration with a faculty member. Many of our Environmental Studies majors find success in graduate school after Whitman.
You can. The Environmental Studies department welcomes professors and students with a broad range of experiences and interests. The core classes—in sciences and humanities—build the foundation for a flexible major, a senior research project of your choice, and a concentration in any number of complementary subjects, like Art, Anthropology, Biology, Chemistry, Environmental Humanities, Geology, History, Physics, Politics or Sociology. If you want to lean heavily into science as an Environmental Studies major, you can. If not, there are plenty of other subjects to pursue as part of the major that will allow you to succeed academically.
The possibilities are limitless. Environmental lawyer. Forest resources officer. Lobbyist. Urban planner. Plus hundreds of other exciting careers. The Environmental Studies major will prepare you for graduate school or an immediate position in research, policy or education. Thanks to the interdisciplinary focus of the major, you’ll graduate with the strong analytical and writing skills necessary for interpreting complex problems and communicating with different audiences. So you’ll be prepared to follow your passions wherever they take you.